
If you are looking to dig deeper into the performance of your WordPress we think you are going to want to check out Query Monitor. Query Monitor is a plugin that provides loads of details about how your WordPress queries and plugins are performing. This isn’t going to tell you how Google ranks your site’s performance or if your site is loading obnoxiously large images, but it will be your partner in dissecting issues with the code running on your site.
Getting Started
Make sure you are logged in as an admin on your WordPress site, head over to the WordPress plugin repository and install Query Monitor, activate it, and visit your site’s homepage. In your WordPress admin bar you should now see a new section with a few key stats about the performance of your site.

This overview displays the time it took to generate the page, the peak memory usage, the database query time, and the number of database queries that were executed for the page.
As a note: Query Monitor will only be active when you are logged-in as an Administrator on single-site installs or Super Admin on Multisite installs, so you don’t need to worry about the public seeing all these performance details.
To access the useful details of Query Monitor you will need to hover over that section of the admin bar and a menu will drop down.
Database queries
Let’s click on the Queries link in the submenu to see the complete list of every database query that the site is making.
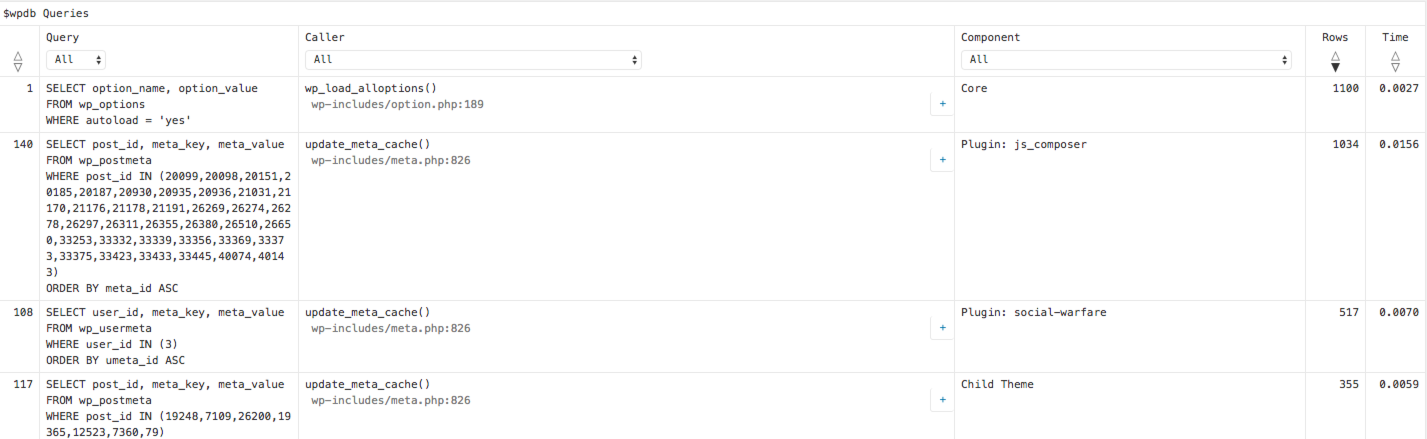
For every single query we can see the full query, what function initiated the query, what component the query is part of, how many results were returned, and how long the query took.
If you are wondering what queries a particular plugin is performing and how long they are taking you can click the Component filter above the queries list and select the plugin.
I like to do a quick check by sorting the list by Rows or Time to find what queries are loading the most results or taking the longest time. Hopefully none of your individual queries are taking more than fractions of a second.
Below the list of all the queries are some summaries organized by what function performed the queries and which components the queries belong to.
Hooks
Heading back to the Query Monitor submenu in the admin bar we should click on the Hooks link to check out every hook being used on the site. Essentially, the whole timeline of everything that happens to load the page, and how each plugin, theme, or core WordPress function contributes to that, will be displayed in order. It can be very insightful and fun to explore the details of all these functions, that are triggered as the page comes together. On the page I am profiling right now there were over 400 functions being called through WordPress hooks. These happen behind the scenes on every page load,so it is great to have a tool to sleuth out potential issues.
HTTP Requests
We wrote a whole article on HTTP requests, but Query Monitor does have a section on HTTP Requests to break down the key requests being used on a page. It shows the main page request and the other requests that happen during the processing of the page retrieval, not all the files that the browser will need to perform requests for. It will show you request response, call stack, and how long the request took.
Rewrite rules
Sometimes it can be very difficult to figure out how WordPress decides what to load for a particular url. The Template Hierarchy explains to us how WordPress figures out what template file to load, but understanding the urls themselves and the logic of rewrite rules can be tricky. From the Query Monitor menu click on Rewrite Rules when viewing a page and it will jump to a block with the Matching Rewrite Rules. This will show you the rewrite rules and what order they are being applied on this page. This is most useful if you have added your own custom Rewrite Rules (a sometimes tricky process) and are trying to see if they have been applied to a particular url.
Redirects
Query Monitor can be very useful for figuring out why a redirect is happening, but to use this tool you will need to have your browser’s developer tools open and view the Headers of the page request.
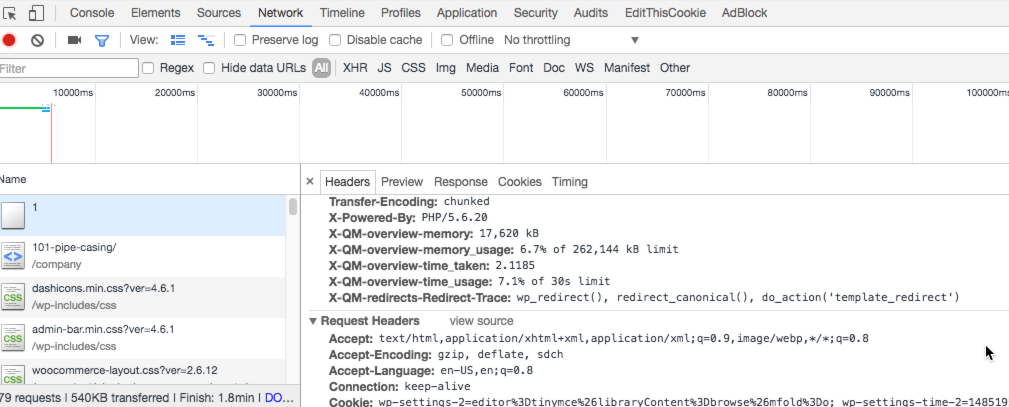
In the page headers a line like this will show up if redirects are happening:
X-QM-redirects-Redirect-Trace: wp_redirect(), redirect_canonical(), do_action('template_redirect’)
This call stack informs us what functions are affecting the redirect process so we can dig deeper into where the redirect may be breaking down along the way.
Other debugging tools that are great
Some really helpful tools for theming are available if you click on Template: …. in the Query Monitor dropdown menu. In this section of the Query Monitor report we can find out exactly which template file is being applied, which template parts may be loading, the parent theme, the child theme, and any body classes being applied. At the bottom of the dropdown menu will be some conditionals as well like is_single(), is_404, is_page(), is_home(), etc.
The Environment section of the Query Monitor report provides key details about the server configuration for php, mySQL, WordPress, and apache/nginx. We can check what error reporting is turned on, the various memory limits that are set, what versions are running, which database is currently in use, and dozens of other details.
The last feature of Query Monitor I wanted to mention is the Transients section. This provides a breakdown of any transient being used during page load. We can see the transient name, expiration, the call stack, and which component (plugin, theme, etc) is using the transient.
Try it out
If you are trying to figure out a performance issue, needing to solve a bug with your site, or simply just curious, I would fully recommend checking out Query Monitor. Let us know if you have any questions on how to use it or see something in your reports that you think may be an issue.